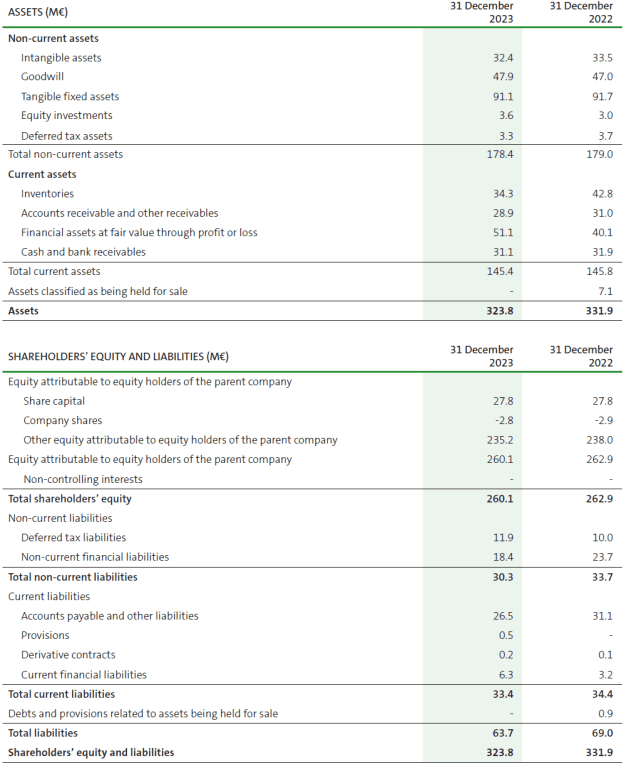
*The balance sheet has not been adjusted in terms of the comparison periods.
Updated on 13 February 2024
Search
We use cookies on our website to give you the most relevant experience by remembering your preferences and repeat visits. By clicking “Accept”, you consent to the use of ALL the cookies. However you may visit Cookie Settings to provide a controlled consent.
This website uses cookies to improve your experience while you navigate through the website. Out of these cookies, the cookies that are categorized as necessary are stored on your browser as they are essential for the working of basic functionalities of the website. We also use third-party cookies that help us analyze and understand how you use this website. These cookies will be stored in your browser only with your consent. You also have the option to opt-out of these cookies. But opting out of some of these cookies may have an effect on your browsing experience.
These cookies are necessary for the website to function and cannot be switched off in our systems. They are usually only set in response to actions made by you which amount to a request for services, such as setting your privacy preferences, logging in or filling in forms. You can set your browser to block or alert you about these cookies, but some parts of the site will not then work. These cookies do not store any personally identifiable information. See cookies
These cookies may be set through our site by our advertising partners. They may be used by those companies to build a profile of your interests and show you relevant adverts on other sites. They do not store directly personal information, but are based on uniquely identifying your browser and internet device. If you do not allow these cookies, you will experience less targeted advertising. See cookies
These cookies allow us to count visits and traffic sources so we can measure and improve the performance of our site. They help us to know which pages are the most and least popular and see how visitors move around the site. All information these cookies collect is aggregated and therefore anonymous. If you do not allow these cookies we will not know when you have visited our site, and will not be able to monitor its performance. See cookies
Functional cookies help to perform certain functionalities such as sharing website content on social media platforms, collect feedbacks, remember language selections, or other third-party features. See cookies